Welcome to the NEM:
The Anatomy of Price Spikes.
Price spikes in the NEM have increased exponentially over the past five years. Between FY 2018/19 and FY 2023/24, spike events above $300/MWh increased by206%. Counterintuitively, price spikes above $5,000 and $10,000 per MWh have decreased over the same period by 6% and 22%, respectively. But the real transformation isn't just about frequency. It's about how these events now concentrate market value, when they occur, and how long they persist. Exploring these aspects is critical to understanding the rush of storage capacity into the market and the implications for market participants of this new reality.

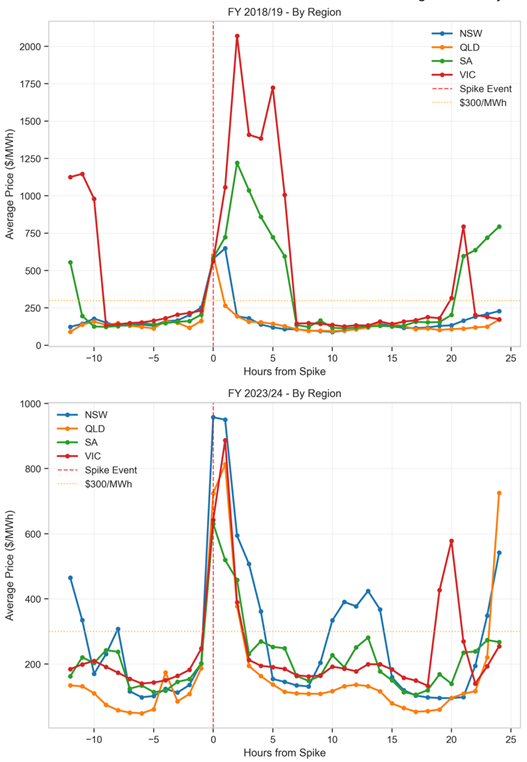
Events by Region
- NSW: 8 → 69 events
- QLD: 5 → 77 events
- SA: 28 → 85 events
- VIC: 14 → 36 events
Revenue Concentration Trends
Substantial changes have occurred in the revenue implications of price spikes. The top 5% of price intervals now capture 29% of total market value across the NEM, up from 21% five years ago. This means roughly 438 hours out of the entire year determine almost a third of all market revenue.

NSW shows the most extreme concentration. The top 5% of intervals now represent 32% of market value, compared to 13.5% in FY 2018/19. Missing just the top 1% of price intervals in NSW means forgoing 17% of potential annual revenue. For any market participant—whether generator, retailer, or storage operator—this concentration has important financial implications. Financial success, and exposure, increasingly depends on being available, properly hedged, and competitive during these critical hours.
South Australia demonstrates how concentrated the market has become. Just 1,202 hours generate 50% of the total market value, down from 2,267 hours in FY 2018/19. This compression means that operational decisions during these hours carry outsized financial consequences. A battery that fails to charge ahead of these periods, or a generator that experiences an outage, faces disproportionate revenue impacts.

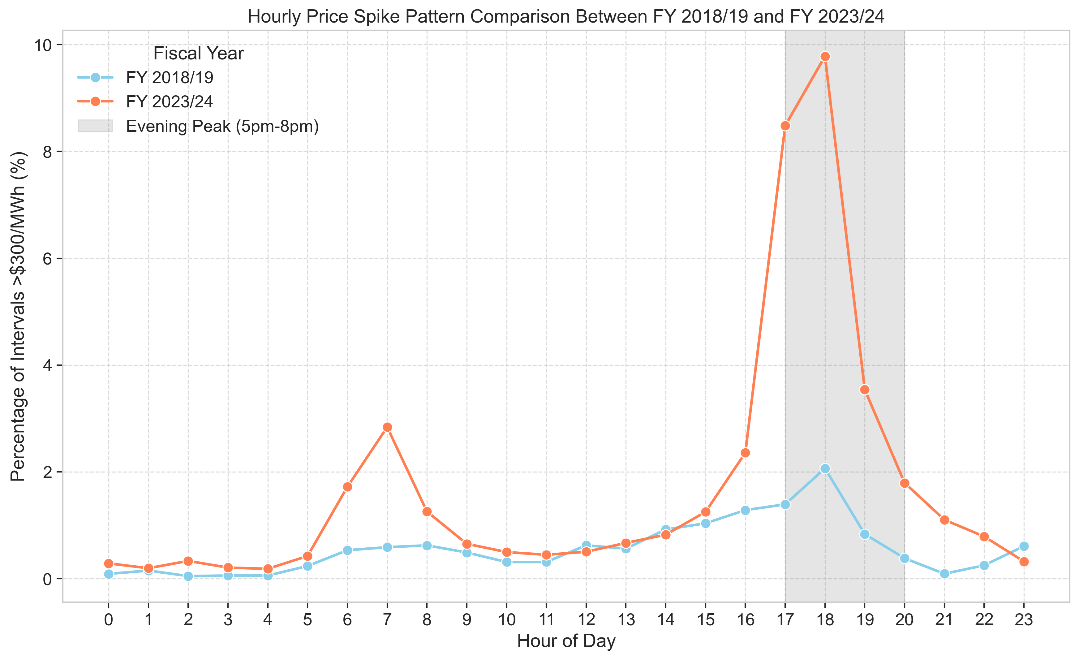
Spike Timing Patterns
This concentration matters because spike timing has become more predictable, even as their intensity has grown. Evening spikes, between 5pm and 8pm, rose by 376% on average in FY 2023/24 compared to FY 2018/19. Queensland saw a whoping 1,979% increase in evening spikes, while NSW was not far behind with a 1,796% jump.

These patterns reflect the market's daily rhythm under high renewable penetration. As solar generation retreats each afternoon, the system increasingly relies on dispatchable generation and stored energy to meet evening demand. The predictability of this transition creates both opportunity and risk. Market participants who position themselves correctly capture significant value.
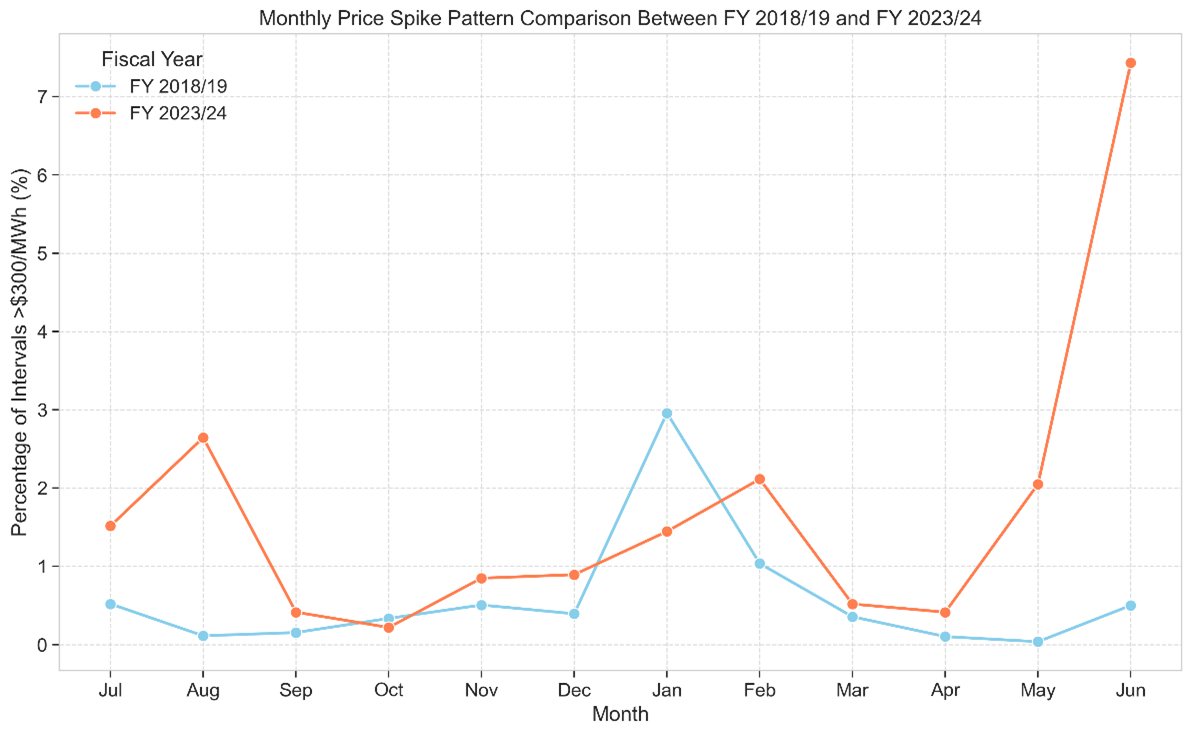
The seasonal shift tells another interesting story. Peak spike frequency and duration have increased from Summer in FY 2018/19 to Winter in FY 2023/24, moving away from traditional summer demand peaks toward winter supply constraints and shoulder season maintenance periods. This change suggests the market's stress points now depend more on supply availability than pure demand levels.
Duration Changes
The extended duration of price spikesamplifies their financial impact. Average spike duration increased 89% from 12minutes to 22.5 minutes between the two periods. NSW saw the largest change,with average spike duration rising 176%.

These longer events create sustained high-cost periods that are harder to hedge and more expensive to weather. This is particularly sensitive for retailers, as such extended high-price periods. Big retailers can get seriously impacted in their financial performance, while smaller retailers could face existential threats to their business.
Recovery Times
Perhaps most affecting to market efficiency are recovery periods, which are lengthening significantly. Median recovery time to 80% of pre-spike price levels doubled from 2 to 4 hours. This extension suggests the market's adjustment mechanisms take longer to normalise prices after extreme events.

Extended recovery periods create prolonged uncertainty for market participants. Price overshoot during recovery occurs in about half of all events, that is, electricity prices spike even higher during the 'recovery' period than they did during the original price spike event. An aftershock that's bigger than the original earthquake. This additional volatility complicates risk management and operational planning.
We will park for a bit here, since price overshoots fundamentally challenge conventional assumptions about market behaviour and price reversion to the mean. This creates complex strategic considerations across market participants.
For battery storage operators, this phenomenon presents a critical operational dilemma: discharging during the initial spike may generate immediate revenue but risks missing substantially higher-value overshoot events. This might require more sophisticated state-of-charge management strategies that balance certain returns against uncertain but potentially superior opportunities.
This operational complexity extends to risk management frameworks, where traditional Value-at-Risk models that focus solely on initial spike events systematically underestimate true market volatility, while hedging strategies must account for the reality that recovery periods represent continued—not diminished—price exposure, fundamentally challenging the assumption that "the worst is over" when initial spikes subside.
Moreover, from a market analysis perspective, price overshoots reveal that traditional volatility metrics and mean-reversion models inadequately capture the full complexity of post-spike dynamics, necessitating longer analytical windows and more sophisticated forecasting approaches that recognize recovery patterns as potentially multi-stage processes rather than simple returns to baseline.
Collectively, these implications suggest that markets exhibiting frequent price overshoots are not merely more volatile, but fundamentally less predictable, requiring market participants to maintain heightened awareness and potentially more conservative position management throughout entire spike-recovery cycles rather than easing the risk controls once initial price extremes appear to have passed.

For the broader market, slower recovery indicates either supply-side rigidities or insufficient demand response. This has implications for market design and regulation, and while every policy intervention is in itself problematic, mechanisms to incentivise demand response could be an opportunity worth looking at.
Market Participant Impact
Diving into these patterns explains why battery deployment has accelerated across the NEM. The combination of predictable timing and concentrated annual value in these events creates compelling business cases for storage investments. Yet, on the big reward of widening price spreads, there is an asymmetric downside. Our analysis suggests missing 20% of the highest-value dispatch intervals can reduce annual revenue by 40% or more. This makes forecasting accuracy and availability management critical success factors.
There are however, a set of distinct challenges and opportunities for other market participants.
Retailers face a more complex risk environment. Increasingly concentrated cost exposure means more frequent spikes, longer durations, and slower recovery, creating extended high-cost periods. Traditional hedging approaches, designed for more predictable patterns, struggle to address these concentrated risks effectively.
For generators, particularly peaking plants, the market now offers feast-or-famine revenue patterns. High availability during spike events captures significant market value, while missing these windows means extended low-revenue periods. This places a premium on reliability and rapid response capability.
The critical question moving forward is sustainability. As more storage enters the market, will these price spikes moderate through increased competition and supply? Or will underlying supply-demand imbalances persist, sustaining opportunities for flexible assets? The answer will determine whether the current storage investment boom can maintain momentum throughout the projected pipeline of 12GW+ of capacity.
Next week, we'll examine the battery investment pipeline and analyse whether the storage gold rush can sustain itself as the market evolves. We'd like to hear from the community:
• Should price spikes be left as a feature of the market, or are there any market mechanisms worth looking at to regulate them?
• For battery operators, what's the optimal balance between chasing daily arbitrage versus targeting less frequent but higher-value spike events?
• How should retailers adapt their risk management strategies to handle increasingly concentrated price exposure?


Our Offices
Brisbane
Shop 2
169 Liechddart St
Spring Hill, 4000
QLD
Sydney
Level 12.02
23 Hunter St,
Sydney, 2000
NSW
Melbourne
Level 17
570 Bourke Street
Melbourne, 3000
VIC